In my last post, I wrote about using a Raspberry Pi Pico to create a wireless thermometer that would capture and send data to a server for later analysis and record keeping. This time, I increased the complexity and built an entire weather station.
Why a Pico?
I've seen a few articles on building a weather station with a regular Raspberry Pi, but I decided to use a Pico for a few reasons:
- To consolidate everything into a smaller form factor
- Reduce power consumption
- Eliminate the need to run an entire OS
- I didn't like the idea of wasting so many pins and resources on a Raspberry Pi compared to the Pico
- Pi's have started to become more expensive compared to the basic $35.00 versions
- To see if I could make it work
Resources
I did follow Raspberry Pi's "Build your own weather station" article to build this, but there were some deviations and changes due to using a Pico and CircuitPython rather than a full Raspberry Pi and Python.
This article from Adafruit was also quite insightful and helped me get multiple tasks running concurrently within the program.
Bill of Materials
To build the weather station, I purchased the following:
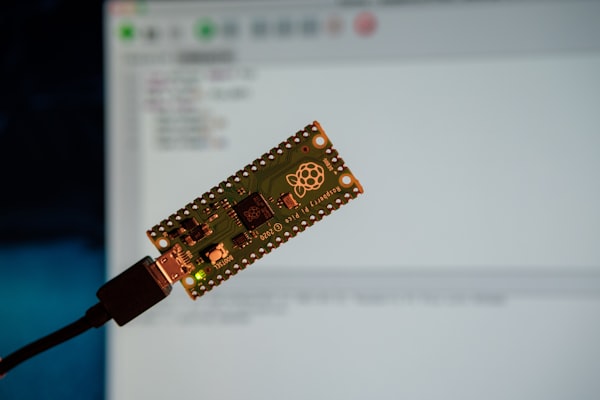
- 1 - Raspberry Pi Pico W ($7.00)
- 1 - BME280 Temp / Humidity / Pressure Sensor ($15.00)
- 1 - DS18B20 Temperature Sensor ($10.00)
- 1 - Anemometer, wind vane, and rain gauge ($68.00)
- 1 - 5-pack RJ11 Connectors ($12.00)
- 1 - USB Cable ($3.00)
Total: $115.00.
The true cost is actually a bit higher, since you have to take shipping into account along with things like a bread board and jumper cables.
Building the Circuit
There are a number of ways to break this out, but I think it makes sense to start with the circuit, and then move into each component within the weather station. The circuit involves connecting four main components to the pico:
- BME280 (temperature / humidity / pressure)
- DS18B20 (temperature)
- RJ11 (rain guage)
- RJJ11 (anemometer & wind vane)
| BME280 | Pico |
|---|---|
| VIN | 3v3 |
| GND | GND |
| SCK | GP1 |
| SD1 | GP0 |
| DS18B20 | Pico |
|---|---|
| Red | 3v3 |
| Yellow | GP2 |
| Blue | GND |
| Rain Guage | Pico |
|---|---|
| 2 | GND |
| 3 | GP4 |
| Anemometer & Wind Vane | Pico |
|---|---|
| 1 | GND |
| 2 | GP3 |
| 3 | GND |
| 4 | GP26 |

Project Structure
Now that the circuit's complete, let's take a look at the project structure.

The weather station is coded with CircuitPython, so the entry point is code.py and the lib directory contains some Adafruit libraries, which can be found here. To keep things organized, the code is separated by function:
- anemometer.py - responsible for the anemometer and measuring the wind speed
- ground_sensor.py - responsible for measuring temperature from the one-wire temperature sensor
- rain_guage.py - responsible for measuring rainfall
- thp_sensor.py - responsible for reading temperature and humidity from the BME280 sensor
- wind_vane.py - responsible for the wind vane and measuring the wind direction
- weather_station.py - the overall parent class containing logic for running the weather station, collecting sensor readings, and submitting them to an API
The Code
Entry point
The entry point for running the weather station is actually very simple, as the core logic is split up into separate files.
from weather_station import WeatherStation

#################################
#          Definitions          #
#################################

DEVICE_ID = "" # Device Id used by the API
TIMEZONE_OFFSET_SECONDS = 21600
TELEMETRY_URL = "" # URL to submit readings

#################################
#             Logic             #
#################################

weather_station = WeatherStation(DEVICE_ID, TIMEZONE_OFFSET_SECONDS, TELEMETRY_URL)
weather_station.start()
code.py
All we're doing is setting some properties, initializing a WeatherStation object, and starting the weather station.
Weather Station
In the weather station file, we're setting up references to each device that's attached to the pico, starting the process to capture sensor readings, and submitting those readings to my API.
import adafruit_requests
import asyncio
import socketpool
import ssl
import time
import wifi

import secrets
from anemometer import Anemometer
from ground_sensor import GroundSensor
from rain_guage import RainGuage
from thp_sensor import ThpSensor
from wind_vane import WindVane


class WeatherStation():
    def __init__(self, deviceId, offsetSeconds, telemetryUrl):
        self.device_id = deviceId
        self.offset = offsetSeconds
        self.telemetry_url = telemetryUrl

        self.anemometer = Anemometer()
        self.ground_sensor = GroundSensor()
        self.rain_guage = RainGuage()
        self.thp_sensor = ThpSensor()
        self.wind_vane = WindVane()
        self.pool = None
        self.requests = None
        self.connect_to_wireless()
        self.configure_requests()
        print("Hello Weather Station!")


    def connect_to_wireless(self):
        wifi.radio.connect(ssid=secrets.SSID, password=secrets.PASSWORD)
        print("Connected: ", wifi.radio.ipv4_address)


    def configure_requests(self):
        self.pool = socketpool.SocketPool(wifi.radio)
        self.requests = adafruit_requests.Session(self.pool, ssl.create_default_context())


    def format_time(self, datetime):
        return "{:04}-{:02}-{:02}T{:02}:{:02}:{:02}.000+00:00".format(
            datetime.tm_year,
            datetime.tm_mon,
            datetime.tm_mday,
            datetime.tm_hour,
            datetime.tm_min,
            datetime.tm_sec
        )


    def generate_telemetry(self):
        utc_timestamp = int(time.time() + self.offset)
        deviceId = self.device_id
        formatted_timestamp = self.format_time(time.localtime(utc_timestamp))

        return [
            {
                "deviceId": deviceId,
                "timestamp": formatted_timestamp,
                "key": "temperature",
                "value": self.thp_sensor.get_temperature_f()
            },
            {
                "deviceId": deviceId,
                "timestamp": formatted_timestamp,
                "key": "humidity",
                "value": self.thp_sensor.get_humidity()
            },
            {
                "deviceId": deviceId,
                "timestamp": formatted_timestamp,
                "key": "pressure",
                "value": self.thp_sensor.get_pressure()
            },
            {
                "deviceId": deviceId,
                "timestamp": formatted_timestamp,
                "key": "ground_temperature",
                "value": self.ground_sensor.get_temperature_f()
            },
            {
                "deviceId": deviceId,
                "timestamp": formatted_timestamp,
                "key": "rainfall",
                "value": self.rain_guage.measure_rainfall()
            },
            {
                "deviceId": deviceId,
                "timestamp": formatted_timestamp,
                "key": "wind_speed",
                "value": self.anemometer.calculate_average_windspeed()
            },
            {
                "deviceId": deviceId,
                "timestamp": formatted_timestamp,
                "key": "wind_direction",
                "value": self.wind_vane.calculate_average_wind_direction()
            },
        ]


    def post_telemetry(self, telemetry_json):
        try:
            header = {
                "Authorization": "Bearer " + secrets.TOKEN
            }
            response = self.requests.post(self.telemetry_url, json=telemetry_json, headers=header)
            json_response = response.json()
            print("Response:", json_response)
        except Exception as e:
            print("Error posting telemetry:", str(e))


    async def query_sensors(self):
        while True:
            await asyncio.sleep(15)
            try:
                telemetry = self.generate_telemetry()

                for item in telemetry:
                    self.post_telemetry(item)
            except Exception as e:
                print("Error retrieving telemetry!", str(e))


    async def main(self):
        rain_guage_task = asyncio.create_task(self.rain_guage.tip_handler())
        anemometer_task = asyncio.create_task(self.anemometer.spin_handler())
        wind_speed_task = asyncio.create_task(self.anemometer.measure_wind_speed())
        wind_direction_task = asyncio.create_task(self.wind_vane.measure_wind_direction())
        core_task = asyncio.create_task(self.query_sensors())

        print("Starting...")
        await asyncio.gather(rain_guage_task, anemometer_task, wind_speed_task, wind_direction_task, core_task)


    def start(self):
        asyncio.run(self.main())
weather_station.py
Lets take a look at what's happening in the main functions:
- __init__ - Here, we're initializing each of our child sensors, connecting to wireless, and setting up our connection pool in order to make http requests.
- start - This is the function called from code.py, and actually kicks everything off. All we're doing is starting the main() function asynchronously.
- main - the main function creates an asynchronous task for reading the rain gauge, anemometer, windspeed, and wind direction as well as the core function of querying sensors. Once the tasks are created, we start them.
- query_sensors - query_sensors runs on an interval, gathering sensor readings and submitting the telemetry every 15 seconds, though this could be changed to any duration.
- generate_telemetry - this method creates and returns the json object that contains sensor readings. In my case, I'm setting the timestamp to a UTC value for storage, which will then display an appropriate time zone when viewed through the react front end for managing everything.
- post_telemetry - post_telemetry is responsible for creating the authorized http request to my api which then stores the telemetry in a database.
Anemometer
The anemometer is responsible for measuring the wind speed. In effect, what I'm doing is:
- counting the number of times that the sensor triggers while spinning over a 5 second duration
- keeping track of the values
- calculating an average and resetting the counts any time the readings are requested
import asyncio
import board
import keypad

from math import pi

ANEMOMETER_FACTOR = 1.18 # https://projects.raspberrypi.org/en/projects/build-your-own-weather-station/5
ANEMOMETER_RADIUS_CM = 9
CM_TO_MI_FACTOR = 44.704
MEASURE_TIME_S = 5

class Anemometer():
    def __init__(self):
        self.circumference_cm = (2 * pi) * ANEMOMETER_RADIUS_CM
        self.spin_triggers = 0
        self.wind_readings = []
        print("Hello Anemometer!")


    async def spin_handler(self):
        with keypad.Keys((board.GP3,), value_when_pressed=False) as keys:
            while True:
                event = keys.events.get()
                if event:
                    if event.pressed:
                        self.spin_triggers = self.spin_triggers + 1
                        #print("pin went low")
                    #elif event.released:
                        #print("pin went high")
                await asyncio.sleep(0)


    async def measure_wind_speed(self):
        while True:
            self.spin_triggers = 0
            await asyncio.sleep(MEASURE_TIME_S)
            self.wind_readings.append(self.calculate_wind_speed_mph(MEASURE_TIME_S))


    def calculate_wind_speed_mph(self, time_s):
        rotations = self.spin_triggers / 4
        distance_cm = self.circumference_cm * rotations
        speed_cm_s = distance_cm / time_s
        speed_mi_h = speed_cm_s / CM_TO_MI_FACTOR
        return speed_mi_h * ANEMOMETER_FACTOR


    def calculate_average_windspeed(self):
        speed_sum = sum(self.wind_readings)
        reading_count = len(self.wind_readings)
        self.wind_readings = []
        if reading_count > 0:
            return speed_sum / reading_count
        else:
            return 0
anemometer.py
The constants at the top came from the raspberry pi article for building a weather station, and there's a good explanation of what they are and the logic of how this works if you're interested in taking a look.
Logic in spin_handler is a way to imitate IRCs in CircuitPython. Every time the input goes high, the count is increased, which prevents us from having to continuously poll for a high or low value from the pin on some interval.
Ground Sensor
The ground sensor is pretty simple compared to the anemometer. We can take measurements at will, and Adafruit's libraries make this trivial.
import board
from adafruit_ds18x20 import DS18X20
from adafruit_onewire.bus import OneWireBus

class GroundSensor():
    def __init__(self):
        self.ow_bus = OneWireBus(board.GP2)
        self.ds18 = DS18X20(self.ow_bus, self.ow_bus.scan()[0])
        print("Hello Ground Sensor!", self.get_temperature_f())


    def get_temperature_f(self):
        return self.ds18.temperature * 1.8 + 32


    def get_temperature_c(self):
        return self.ds18.temperature
ground_sensor.py
Rain Gauge
For the rain gauge, there's a tilting device that tips once enough water has been collected, so all we have to do is count the number of tips to calculate the quantity of rainfall. Here, we're utilizing the same technique as in anemommeter.py, where we setup an event handler to count the number of tips.
import asyncio
import board
import keypad

RAIN_MM_PER_TIP = 0.2794

class RainGuage():
    def __init__(self):
        self.tips = 0
        print("Hello Rain Guage!")


    async def tip_handler(self):
        with keypad.Keys((board.GP4,), value_when_pressed=False) as keys:
            while True:
                event = keys.events.get()
                if event:
                    if event.pressed:
                        self.tips = self.tips + 1
                        #print("pin went low")
                    #elif event.released:
                        #print("pin went high")
                await asyncio.sleep(0)


    def measure_rainfall(self):
        total_mm = self.tips * RAIN_MM_PER_TIP
        self.tips = 0
        return total_mm
rain_gauge.py
THP Sensor
Just like the onewire / ground temperature sensor, the THP sensor is fairly trivial thanks to Adafruit's libraries. We can calculate the temperature, pressure, humidity, and altitude any time we want.
import board
import busio

from adafruit_bme280 import basic as adafruit_bme280

class ThpSensor():
    def __init__(self):
        # Create a sensor object using the board's default I2C bus
        self.i2c = busio.I2C(board.GP1, board.GP0)
        self.bme280 = adafruit_bme280.Adafruit_BME280_I2C(self.i2c)

        # Set the location's pressure (hPa) at sea level
        self.bme280.sea_level_pressure = 1013.25
        print("Hello ThpSensor!", self.get_temperature_f())


    def get_temperature_f(self):
        return self.bme280.temperature * 1.8 + 32


    def get_temperature_c(self):
        return self.bme280.temperature


    def get_humidity(self):
        return self.bme280.relative_humidity


    def get_pressure(self):
        return self.bme280.pressure


    def get_altitude(self):
        return self.bme280.altitude
thp_sensor.py
Wind Vane
The wind vane was the most challenging part in my opinion. There's an explanation of how it works in the raspberry pi article, but essentially, you have to connect a resistor to the circuit to measure voltages, and then associate each voltage to an angle to get the direction from which the wind is coming.
If you want to know the actual cardinal direction, you then have to assign each numerical angle to the correct cardinal direction, but this could change based on the rotation of the wind vane itself.
import analogio
import asyncio
import board
import math

CONVERSION_FACTOR = 3.3 / 65535 # 5v / highest reading
MEASURE_TIME_S = 5
VOLT_ANGLES = {
    0.6 : 0,
    1.1 : 45,
    1.5 : 90,
    2.6 : 135,
    3.2 : 180,
    3.1 : 225,
    2.9 : 270,
    2.1 : 315,
}

class WindVane():
    def __init__(self):
        self.wind_vane = analogio.AnalogIn(board.GP26)
        self.wind_readings = []
        print("Hello Wind Vane!")


    async def measure_wind_direction(self):
        while True:
            await asyncio.sleep(MEASURE_TIME_S)
            voltage = round(self.wind_vane.value * CONVERSION_FACTOR, 1)
            if voltage in VOLT_ANGLES:
                self.wind_readings.append(VOLT_ANGLES[voltage])


    def calculate_average_wind_direction(self):
        reading_count = len(self.wind_readings)
        if reading_count == 0:
            return 0.0

        sin_sum = 0.0
        cos_sum = 0.0

        for angle in self.wind_readings:
            radians = math.radians(angle)
            sin_sum += math.sin(radians)
            cos_sum += math.cos(radians)

        floatLen = float(reading_count)
        sin = sin_sum / floatLen
        cos = cos_sum / floatLen
        arc = math.degrees(math.atan(sin / cos))
        average = 0.0

        if sin > 0 and cos > 0:
            average = arc
        elif cos < 0:
            average = arc + 180
        elif sin < 0 and cos > 0:
            average = arc + 360

        self.wind_readings = []
        return 0.0 if average == 360 else average
wind_vane.py
For the conversion factor, I'm utilizing 3.3 instead of 5 because the pico's output is only 3.3 volts instead of the raspberry pi's 5 volts.
Seeing it in action
With the circuit built and everything coded, what does it look like in reality? Let's startup Thonny and take a look.

Printing out the results, we can see both the API response, as well as the data that was sent with each request. We can also see the results looking at the database itself.

Next Steps
I'm excited that the weather station is working, but it currently resides on a breadboard and isn't in production. The next steps will be:
- Creating a PCB design to solder the components
- Use a CNC machine to cut out / create the PCB
- Design an enclosure to fit all of the pieces
- 3D print the enclosure
- Mount the weather station outside for production use
I'm looking forward to posting about those results in a future article 😄